


Glycolysis/OXPHOS Assay Kit

Glycolysis/Oxidative phosphorylation Assay
- Easy test via plate reader, no need for expensive equipment
- All reagent acquired is included, ready to use kit
- Easy-to-understand detailed protocol
-
Product codeG270 Glycolysis/OXPHOS Assay Kit
| Unit size | Price | Item Code |
|---|---|---|
| 50 tests | G270-10 |
Please refer to the Q&A How many samples can be tested by this kit?.
| 50 tests | ・Dye Mixture ・Lactate Standard ・LDH Solution ・Lactate Assay Buffer ・Reconstitution Buffer ・Substrate ・Luciferase Solution ・ATP Assay Buffer ・Oligomycin ・2-DG |
×1 150 µl×1 12 µl×1 5.5 ml×1 550 µl×1 ×1 10 µl×1 5.5 ml×1 ×1 140 µl×1 |
|---|
Description
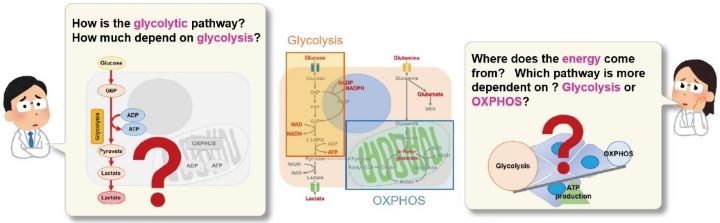
Many cancer cells produce ATP through energy metabolism that depends on the glycolytic pathway. On the other hand, it has been recently reported that cancer cells whose glycolytic pathway is suppressed survive by shifting their energy metabolism to oxidative phosphorylation(OXPHOS). These phenomena has attracted much attention because it will not only help elucidate the mechanisms of anticancer drugs but also lead to the development of therapeutic strategies in various diseases including aging and neurodegenerative disorders.
This kit evaluates glycolytic capacity, metabolism shift, and whether cells rely on the glycolytic system or oxidative phosphorylation for energy production using a plate reader. This ready-to-use kit includes all the reagents acquired.


Manual
Technical info
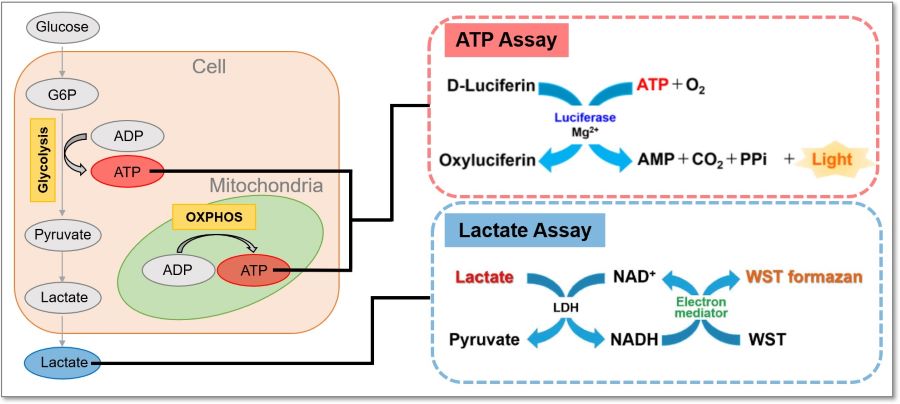
This kit measures the concentration of intracellular adenosine triphosphate (ATP) by the luciferase luminescence method and the amount of lactate released from cells by the absorbance method using water soluble tetrazolium (WST) formazan. Using the inhibitors contained in this kit, it is possible to evaluate a shift in the intracellular metabolism between glycolysis and oxidative phosphorylation (OXPHOS). In addition, this kit can be used with microplates.
Three Applications
The inhibition of ATP synthesis via OXPHOS by oligomycin or inhibition of ATP synthesis via glycolysis by 2-deoxy-D-glucose (2-DG) can be determined by measuring changes in the amounts of ATP (luminescence value) and lactate (absorbance value), respectively, which can be used to evaluate the following three pathways.
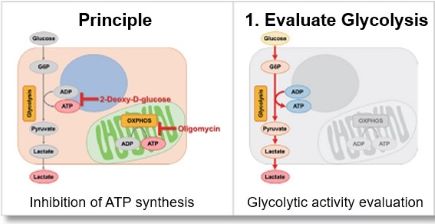
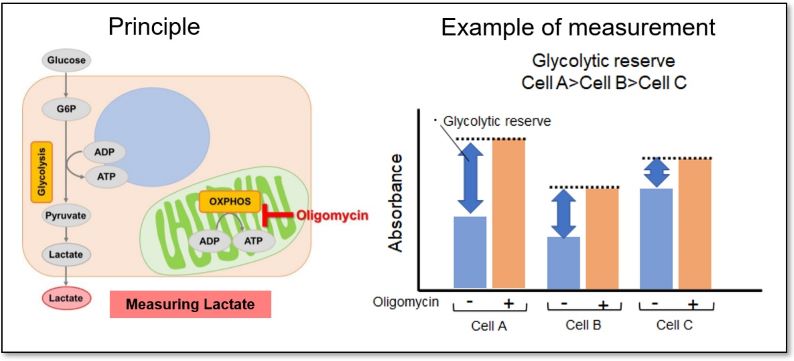
Evaluation 1: Glycolytic capacity
Oligomycin is used to inhibit ATP synthesis by OXPHOS, and then the potential of the glycolytic pathway using lactate production as an indicator can be evaluated.
<Application Data>
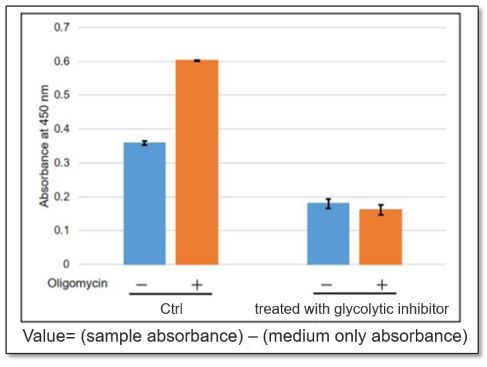
The glycolytic capacity of HeLa cells treated with a glycolytic inhibitor (2-DG concentration: 2 mmol/l) was compared with that of untreated HeLa cells (control). When ATP synthesis by OXPHOS was inhibited by oligomycin, the glycolytic pathway was enhanced in the control cells, but not in cells in which the glycolytic pathway was inhibited.
*For more details, please refer to General Protocol ① (Analysis of Cellular Glycolytic Capacity) on page 3 of the manual.
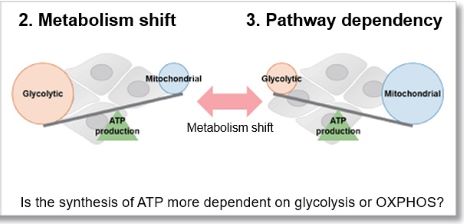
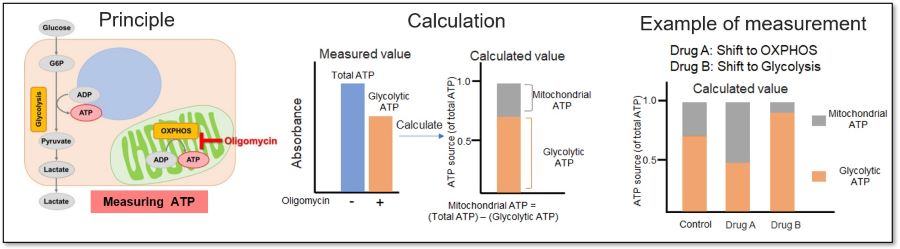
Evaluation 2: Metabolism shift
Measuring the ATP levels in oligomycin-treated cells and control cells can be used to calculate the amount of ATP synthesized by mitochondria, which is an indicator of a shift in cellular metabolism.
<Application Data>
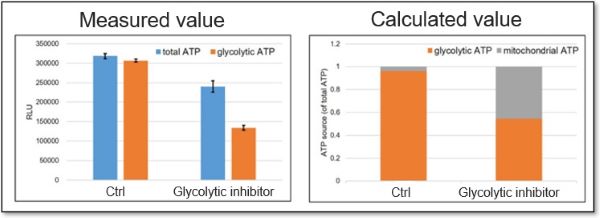
We evaluated whether treatment with a glycolytic inhibitor (2-DG concentration: 2 mmol/l) would cause a metabolic shift in HeLa cells. The ATP production capacity of the control cell group was dependent on the glycolytic pathway, whereas inhibition of the glycolytic pathway in HeLa cells shifted ATP production from glycolysis to OXPHOS and increased ATP production in the mitochondria.
*For more details, please refer to General Protocol ② (Analysis of Metabolism Shift) on page 5 of the manual.
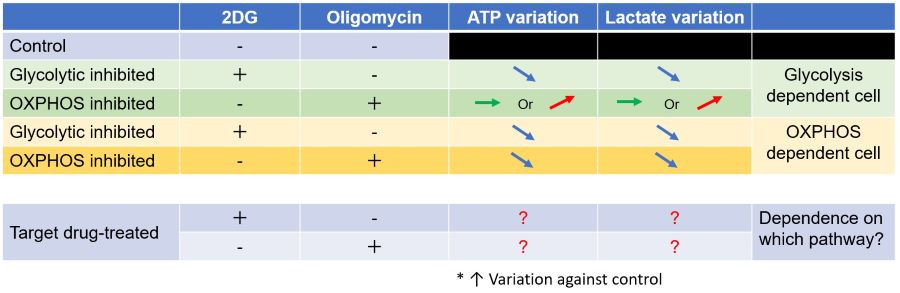
Evaluation 3: Metabolic pathway dependence
Combining methods (1) and (2) can be used to measure the metabolic pathway dependency of cells.
Cells are treated with oligomycin or 2-DG to inhibit OXPHOS or ATP synthesis in the glycolytic pathway, and the amounts of ATP and lactate production are measured, respectively. Changes in the amount of ATP can be used to determine the efficiency of energy production, and changes in the amount of lactate produced can be used to determine changes in glycolytic capacity and evaluate whether cells are dependent on glycolysis or OXPHOS.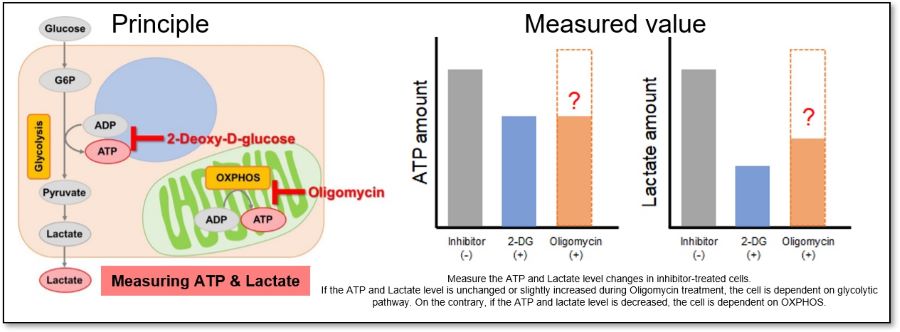
<Application Data>
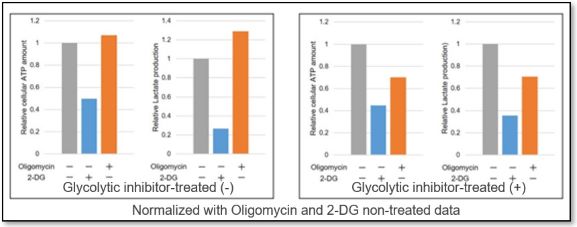
We evaluated the metabolic pathway dependence of HeLa cells treated with a glycolytic inhibitor (2-DG concentration: 2 mmol/l).
ATP levels in the cells without glycolytic system inhibition treatment were markedly reduced by 2-DG treatment but were unchanged by oligomycin treatment. The amount of lactate production was increased by oligomycin treatment. This indicates that metabolism in HeLa cells in the absence of glycolytic inhibitor treatment is highly dependent on the glycolytic system.
In contrast, oligomycin treatment did not increase lactate production in the glycolytic inhibitor-treated cells, and ATP levels were markedly reduced by oligomycin treatment. In addition, the amount of ATP was decreased significantly after oligomycin treatment, indicating that the metabolism of glycolysis-inhibited HeLa cells depended on OXPHOS.
*For more details, please refer to General Protocol ③ (Analysis of Metabolic Pathway Dependence) on page 8 of the manual.
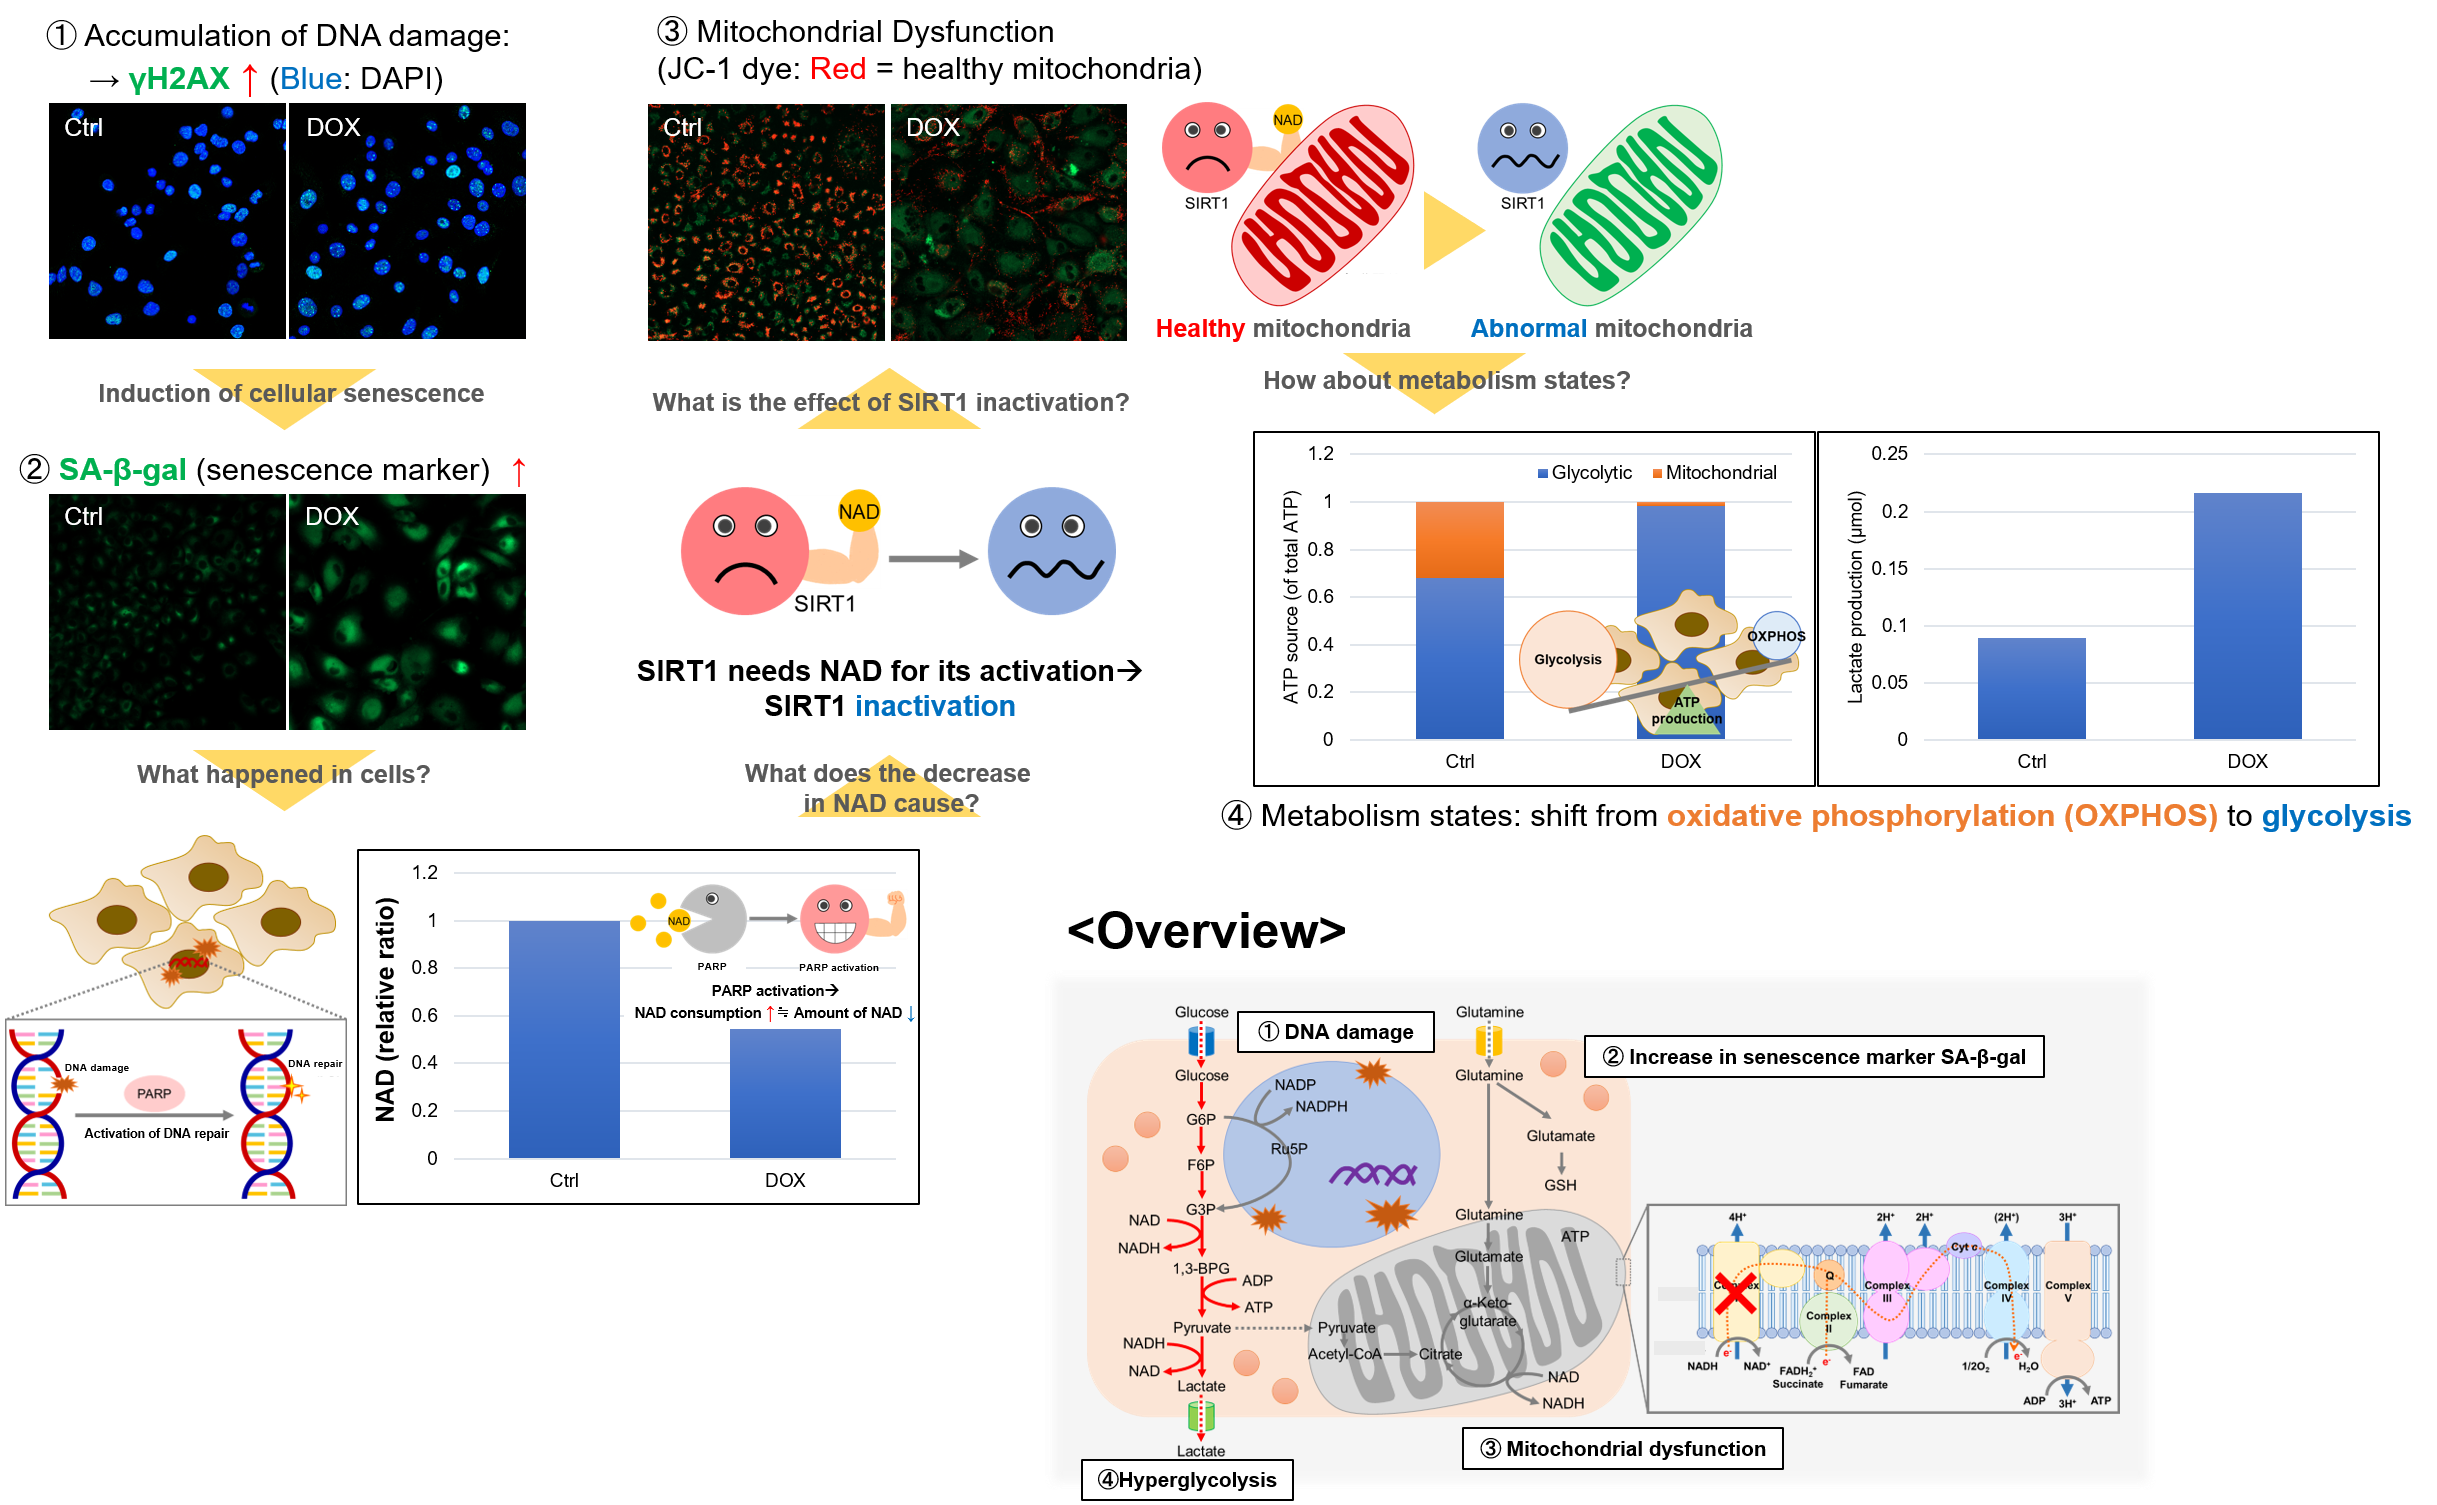
Experiment Example: Cellular Senescence with Metabolic shift
NAD(+) levels decline during the aging process, causing defects in nuclear and mitochondrial functions and resulting in many age-associated pathologies*. Here, we try to redemonstrate this phenomenon in the doxorubicin (DOX)-induced cellular senescence model with a comprehensive analysis of our products.
*S. Imai, et al., Trends Cell Biol, 2014, 24, 464-471
Related Products
| Category | Product | Unit | SKU |
|---|---|---|---|
|
Cellular Metabolism |
100 tests |
N509-10 |
|
| Lactate Assay Kit-WST | 50 / 200 tests | L256-10 / L256-20 | |
| Glycolysis/OXPHOS Assay Kit NEW | 50 tests | G270-10 | |
|
Cellular Senescence Detection |
1 / 3 / 10 plates |
SG04-01 / SG04-03 / SG04-10 |
|
|
Mitochondrial Membrane Potential |
10 set |
MT09-10 |
Application Data: Comparison of metabolic pathway dependence in different cell lines
Many cancer cells produce ATP through the glycolytic pathway. On the other hand, it has been recently reported that cancer cells whose glycolytic pathway is suppressed survive by shifting their energy metabolism to OXPHOS by enhancing mitochondrial function, and the dependency of metabolic pathways differs depending on cell lines.
The dependence of OXPHOS and Glycolysis in two types of cancer cells, HeLa and HepG2, were compared based on Lactate production, ATP levels, and OCR values.
<Evaluation by Lactate production and ATP levels>
We confirmed the changes in ATP and Lactate production when ATP synthesis by OXPHOS was inhibited by Oligomycin stimulation and by 2-Deoxy-D-glucose (2-DG) in the glycolytic pathway. The results showed that HeLa cells depend on Glycolysis and HepG2 cells depend on OXPHOS to synthesize ATP.
*Please refer to the "Supplementary information on technology and products used" section on the right for additional information on the results.
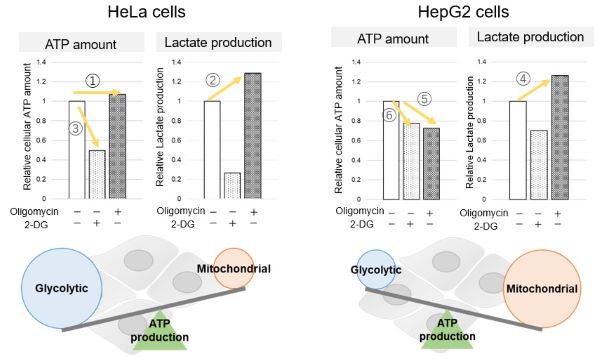
Evaluated with: Glycolysis/OXPHOS Assay Kit (Code: G270)
<Evaluation by OCR value>
Using the same number of cells, we measured the OCR value when cellular oxygen consumption was promoted by stimulating the cells with FCCP, a mitochondrial uncoupling agent. The results showed that HepG2 cells had higher OCR values than HeLa cells, suggesting a greater dependence on OXPHOS, correlating with the results obtained from ATP level and Lactate production.
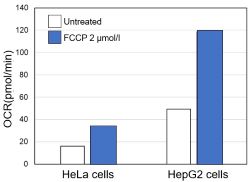
〈Experimental Condtions〉
Cell line: HeLa, HepG2
Cell number: 5×10⁴ cells/well
Stimulation: FCCP
Concentration: 2 μmol/l
Evaluated with: Extracellular OCR Plate Assay Kit (Code: E297)
Supplementary information on technology and products used
<Evaluation by Lactate production and ATP levels>
When OXPHOS was inhibited in HeLa cells, ATP levels remained unchanged (①), and lactate production increased (②). This suggests that even when OXPHOS is inhibited, glycolysis can be further activated. Conversely, when glycolysis is inhibited, ATP levels decrease significantly (③), indicating that energy production depends on glycolysis. On the other hand, when OXPHOS was inhibited in HepG2 cells, lactate production increased (④), indicating that the cells attempt to compensate for energy production by enhancing glycolysis, but ATP levels still decrease (⑤). This means that even with increased glycolysis, ATP production is not sufficiently compensated. Furthermore, ATP levels decrease more when glycolysis is inhibited (⑥), suggesting that energy production in HepG2 cells depends more on OXPHOS than glycolysis.
References
| No. | Sample | Reference |
|---|---|---|
| 1 | Cell (RAW264.7) |
H. Gu, Y. Zhu, J. Yang, R. Jiang, Y. Deng, A. Li, Y. Fang, Q. Wu, Honghuan Tu, Haishuang Chang, Jin Wen, and X. Jiang, "Liver-Inspired Polyetherketoneketone Scaffolds SimulateRegenerative Signals and Mobilize Anti-InflammatoryReserves to Reprogram Macrophage Metabolism for Boosted Osteoporotic Osseointegration", Adv. Sci., 2023, doi.org/10.1002/advs.202302136. |
| 2 | Cell (A549) |
L. Liu, B. Wang, R. Zhang, Z. Wu, Y. Huang, X. Zhang, J. Zhou, J. Yi, J. Shen, M. Li, and M. Dong, "The activated CD36-Src axis promotes lung adenocarcinoma cell proliferation and actin remodeling-involved metastasis in high-fat environment", Cell Deat & Disease, 2023, doi.org/10.1038/s41419-023-06078-3. |
| 3 | Canine GL cell lines | H. Yamazaki, S. Onoyama, S. Gotani, T. Deguchi, M. Tamura, H. Ohta, H. Iwano, H. Nishida, P.J. Dickinson and H. Akiyoshi, 'Influence of the Hypoxia-Activated Prodrug Evofosfamide (TH-302) on Glycolytic Metabolism of Canine Glioma: A Potential Improvement in Cancer Metabolism', Cancers, 2023, doi:10.3390/cancers15235537. |
| 4 | Cell (Primary Hepatocyte) |
S. Tsuno, K. Harada, M. Horikoshi, M. Mita, T. Kitaguchi, M. Y. Hirai, M. Matsumoto and T. Tsubo , 'Mitochondrial ATP concentration decreases immediately after glucose administration to glucose-deprived hepatocytes', FEBS Open Bio, 2023, doi:10.1002/2211-5463.13744. |
Q & A
-
Q
How many samples can be tested by this kit?
-
A
Analyzing samples and standards in triplicate is recommended for accuracy. The number of samples that can be measured is shown in the table below, assuming that each independent sample is measured in triplicate.
50 tests Lactate Assay ATP Assay Glycolysis Metabolism Shift Metabolic pathway
DependenceGlycolysis Metabolism Shift Metabolic pathway
Dependence96 well plate 48 well 48 well 48 well 48 well Number of Samples
(n=3)6 samples 4 samples 8 samples 5 samples
*This is the maximum number of samples that can be measured without pre-experiment.
*If the medium contains serum, it is recommended to measure the lactate concentration in the medium as a background control for the lactate assay.50 tests Lactate Assay ATP Assay Glycolysis Metabolism Shift Metabolic pathway
DependenceGlycolysis Metabolism Shift Metabolic pathway
Dependence96 well plate 9 well 9 well 21 well 9 well Number of Samples
(n=3)5 samples 4 samples 4 samples 4 samples *This is the maximum number of samples that can be measured with pre-experiment.
*If the medium contains serum, it is recommended to measure the lactate concentration in the medium as a background control for the lactate assay.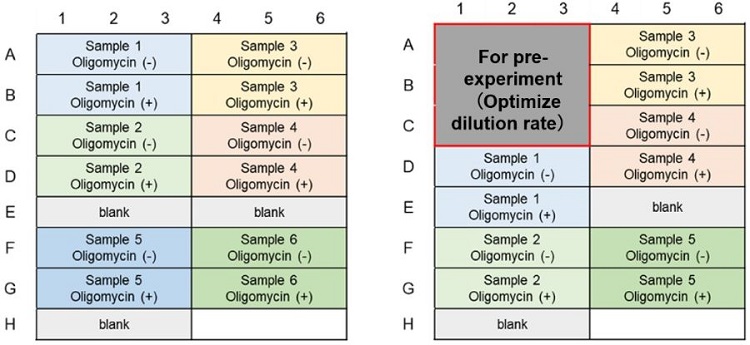
Glycolytic Capacity Evaluation (Lactate Assay); Example of plate layout (n=3)
(Left: Without pre-experiment; Right: With pre-experiment)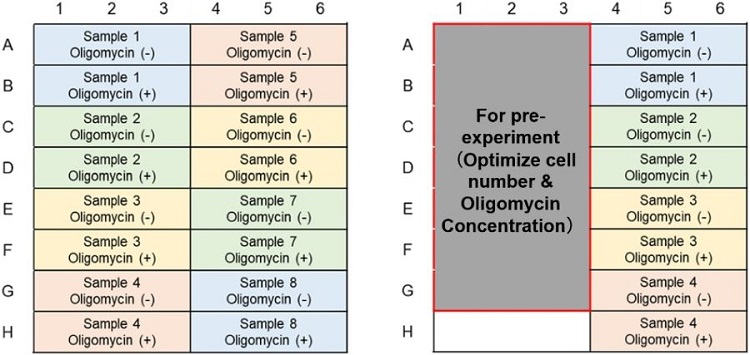
Metabolism Shift Evaluation (ATP Assay); Example of plate layout (n=3)
(Left: Without pre-experiment; Right: With pre-experiment)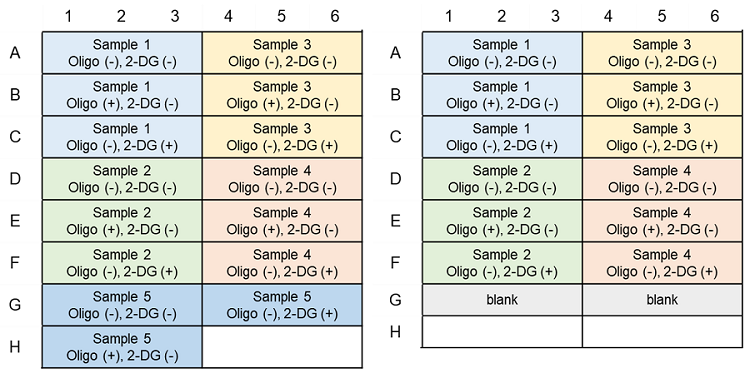
Metabolic Pathway Dependence Evaluation; Example of plate layout (n=3)
(Left: ATP Assay; Right: Lactate Assay)(Without pre-experiment)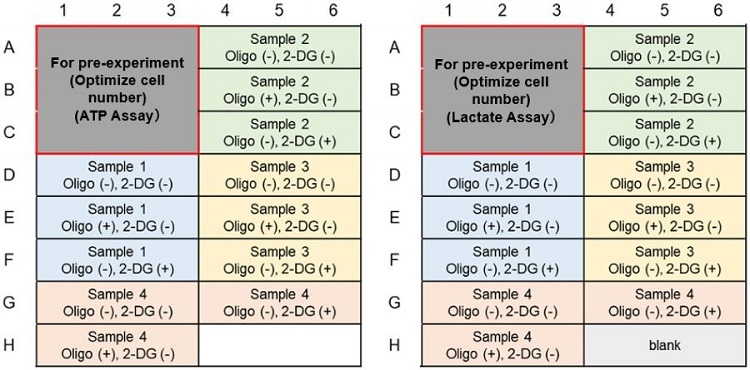
Metabolic Pathway Dependence Evaluation; Example of plate layout (n=3)
(Left: ATP Assay; Right: Lactate Assay)(With pre-experiment)
-
Q
In the glycolysis assay, the absorbance of samples did not differ from that of the blank, what is the possible reason?
-
A
The amount of lactate released from the cells might be low. Try increasing the number of cells or extending the incubation time from 3 hours to 5 hours.
-
Q
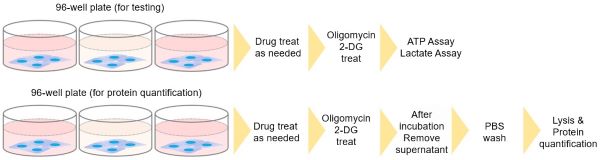
Do I need to normalize the lactate and ATP concentrations, by using a protein quantification assay?
-
A
Because the number of cells before and after drug treatment can change depending on the cell type or drug, it is recommended to confirm the change via a protein quantification method, in advance. Protein quantification cannot be performed in the same wells as the ATP assay or lactate assay. Prepare separate wells for protein quantification.
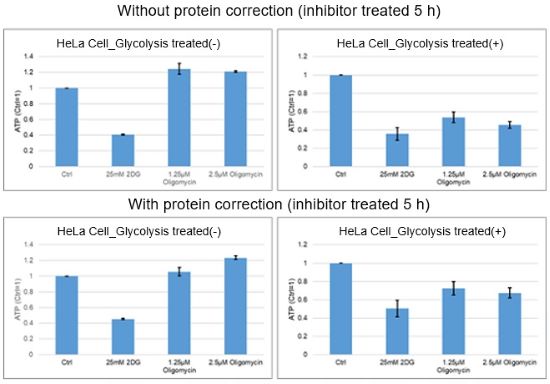
For reference, in the case of HeLa cells treated with oligomycin and 2-DG for 5 hours, there was little difference in the number of cells before and after treatments as assessed by the protein quantification method.
-
Q
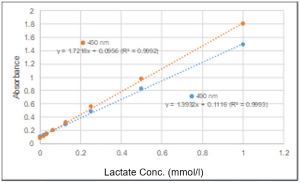
What other filter can be used besides a 450 nm filter?
-
A
You can use filters with an absorbance between 450 nm and 490 nm. However, for the longer wavelengths, the absorbance will be lower than that measured at 450 nm.
-
Q
Can I measure samples or drugs that contain a reducing agent?
-
A
No, you will not be able to accurately measure the lactate concentration, because WST reacts with reducing agents and increases the background. However, if the samples must contain a reducing agent, the reagent blank should be measured as a background control.
-
Q
Can the working solution be stored?
-
A
The working solution cannot be stored for long periods; it should be prepared prior to use. The working solution is stable for 4 hours at room temperature when protected from light.
-
Q
How long is the luminescence signal stable?
-
A
The luminescence signal is stable for 3 hours. If you are not able to measure immediately after reagent addition, store the microplate at 25 ℃ protected from light until measurement.
-
Q
What other microplates can be used besides a white microplate?
-
A
We recommend a white microplate. The luminescence signal with a black microplate tends to be lower than with a white microplate.
-
Q
Can I order the product with a larger unit size?
-
A
Glycolysis/OXPHOS Assay Kit is a combined product of Lactate Assay Kit-WST (product code: L256) and ATP-Assay Kit-Luminescence (Product Code: A550).
A 200 tests unit product is available for both Lactate Assay Kit-WST (product code: L256) and ATP-Assay Kit-Luminescence (Product Code: A550).
Please order these single products in combination for the larger unit size.
Please note that the components themselves of these products are the same, although some component names in the L256 and A550 appear slightly different from this combined product.
product Glycolysis/OXPHOS Assay Kit Lactate Assay Kit-WST component name LDH Solution Enzyme Solution Lactate Assay Buffer Assay Buffer product Glycolysis/OXPHOS Assay Kit ATP-Assay Kit-Luminescence component name Luciferase Solution Enzyme Solution ATP Assay Buffer Assay Buffer
Handling and storage condition
| 1. Store at 0-4℃; 2. Protect from light |
Related products
The following related products are also used in research related to this product.


