


Nucleolus Bright Green

Nucleolus Fluorescent Staining
- Just Add the Reagent to Fixed Cells
- Measures nucleolus, which is used as one of senescence marker
- High Localization in Nucleolus
-
Product codeN511 Nucleolus Bright Green
| Unit size | Price | Item Code |
|---|---|---|
| 60 nmol | N511-10 |
Description
Detection Principle
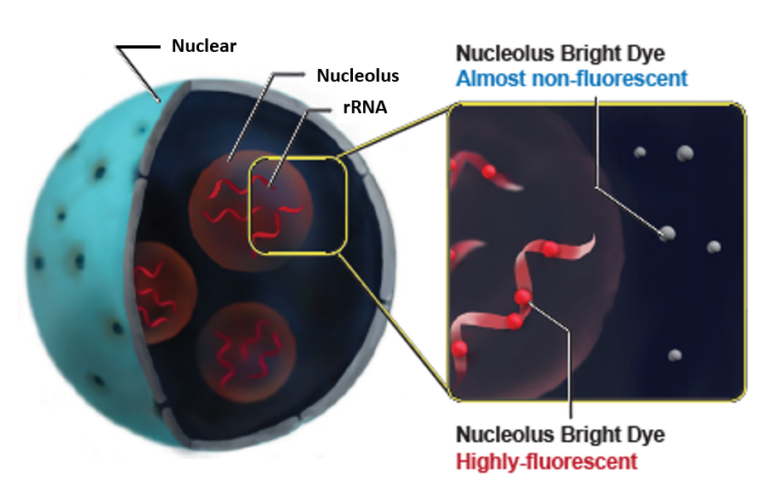
A Nucleolus is one of the structures forming a nucleus and becoming the starting point of the ribosomal biogenesis. There are many ribosomal RNA (rRNA) in the nucleolus and transcription of rRNA and processing are carried out. Whereas the morphological change of nucleolus is known as one of the indicator of cancer diagnosis, there has been some scientific reports describing the relation between nucleolus and DNA damge, autophagy, virus infection, and cellular senescence. Nucleolus Bright dyes are small molecules and they bind to RNA in the nucleolus to emit fluorescnece. The nucleolus can be observed without any washing steps after staining with Nucleolus Bright dyes.
Nucleolus Bright reacts to RNAs present besides nucleolus, but it shows strong fluorescence in nucleolus, which is the site of rRNA production. We recommend to co-stain with DAPI in order to image nucleolus clearly. For co-staining protocol, please refer to the Q&A tab.
| Maximum Excitation Wavelength | Maximum Emission Wavelength | Fluorescence of MeOH fixed cells | Fluorescence of PFA fixed cells | |
| Nucleolus Bright Green | 513 nm | 538 nm | 〇 | 〇 |
| Nucleolus Bright Red | 537 nm | 605 nm | 〇 | 〇 |


Manual
Technical info
After fixing HeLa cells with 4% PFA or MeOH, the cells were washed with PBS and then membrane permeabilized with 1% Triton X-100. Nucleolus Bright Green or Nucleolus Bright Red (N512) and nuclear staining dye, DAPI were added and were imaged using a confocal microscope.
Several nucleoli in the DAPI-stained nucleus (blue) were observed.
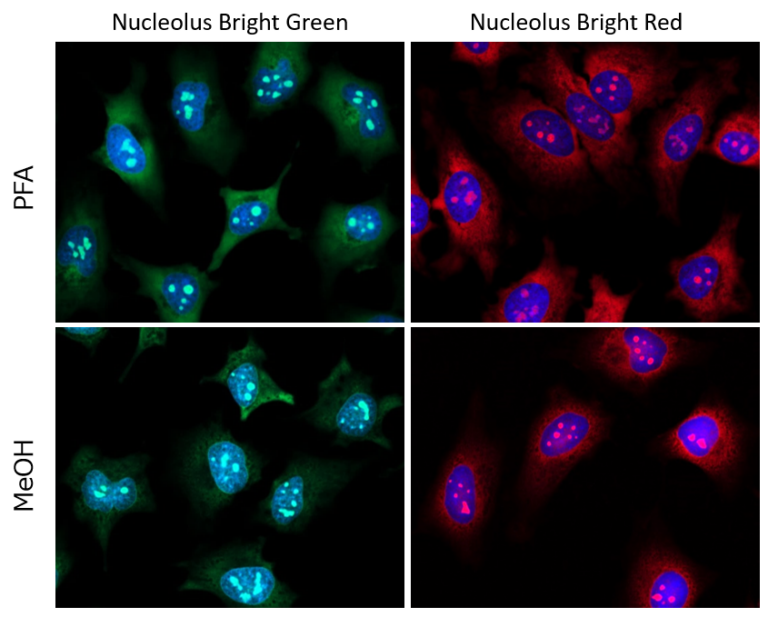
Staining Condition
– Fixation with PFA
Cells were immersed in 4% PFA for 5 minutes, Triton X-100 for 20 minutes. Then incubated in each fluorescent probe for 60 minutes.
– Fixation with MeOH
Cells were immersed in cold MeOH for 1 minute, Triton X-100 for 20 minutes. Then incubated in each fluorescent probe for 5 minutes.
Detection Condition
Nucleolus Bright Green Ex. 488 nm / Em. 500-600 nm
Nucleolus Bright Red Ex. 561 nm / Em. 565-650 nm
DAPI Ex. 405 nm / Em. 450-495 nm
Nucleolus Localization
Passage 3 of WI-38 cells were fixed with 4% PFA and immunostaining was done with Anti-Fibrillarin primary and secondary antibody. Nucleolus Bright Green or Nucleolus Bright Red (N512) and nuclear staining dye, DAPI were added and were imaged using an epifluorescence microscope (Keyence, BZ-X710).
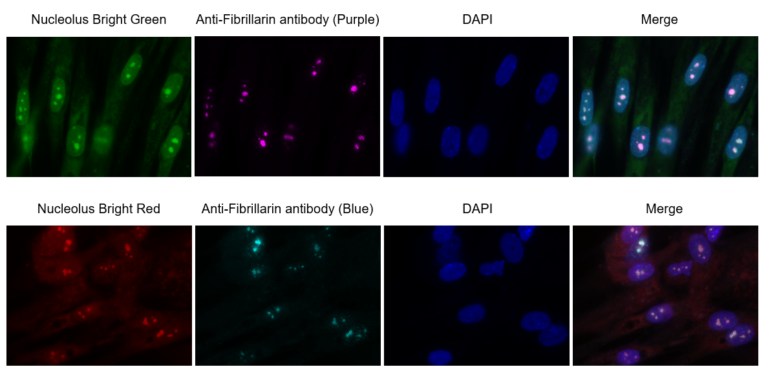
Nucleolus Bright Green: Ex. 450-490 nm / Em. 500-550 nm
Nucleolus Bright Red: Ex. 533-548 nm / Em. 570-640 nm
DAPI: Ex. 340-380 nm / Em. 435-485 nm
Anti-Fibrillarin antibody: Ex. 590-650 nm / Em. 668-733 nm
Detection in Senescent Cells
Different passage WI-38 cells were fixed with 4% PFA and washed with PBS. Then membrane permeabilized with 1% Triton X-100. Nucleolus Bright Green or Nucleolus Bright Red (N512) and nuclear staining dye, DAPI were added and were imaged using a confocal microscope.
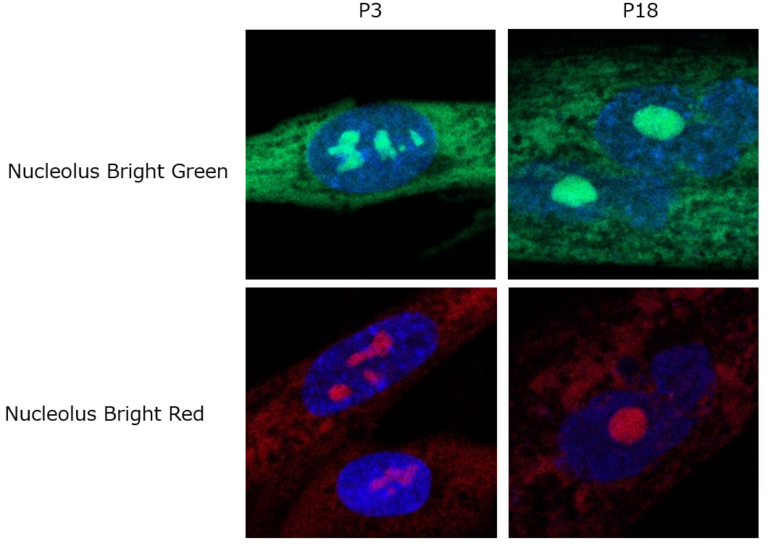
Cells were immersed in 4% PFA for 5 minutes, Triton X-100 for 20 minutes. Then incubated in each fluorescent probe for 5 minutes.
Nucleolus Bright Green: Ex. 488 nm / Em. 500-600 nm
Nucleolus Bright Red: Ex. 561 nm / Em. 565-650 nm
DAPI: Ex. 405 nm / Em. 450-495 nm
[Related publications] 1) Greenberg, R. A. et al., Cell Reports, 2015, 13, 251.
2) Kimura, K. et al., Scientific Reports, 2015, 5, 8903.
3) Hiscox, J. A. et al., Cellular Microbiology, 2006, 8, 1147.
4) Nakao, M. et al., Cell Reports, 2017, 18, 2148.
5) Antebi, A. et al., Trends in Cell Biology, DOI: 10.1016/j.tcb.2018.03.007.
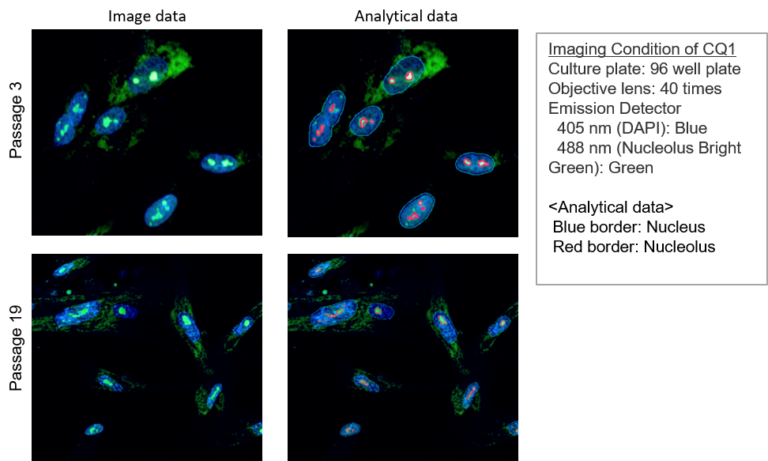
Quantification with confocal quantitative image cytometer
The WI-38 cells at different passage numbers were stained with Nucleolus Bright Green and DAPI after fixation. Each of the stained cells was then analyzed using a confocal quantitative image cytometer CQ1(Yokogawa Electric Corporation).
Analysis of nucleolus by imaging data
The nucleus and nucleolus imaging data was measured at 405 nm and 488 nm as an emission wavelength and the number of nucleolus in a nucleus was analyzed by CellPathfinder.
Analysis of the number of nucleolus
The proportion of cells containing one nucleolus had increased while cells with more than one nucleoli decreased as seen in the cells of passage 19. This result corresponds with the data of the published reports. One report suggested that the number of nucleoli was decreased in senescent WI-38 cells.*1 Another report suggested that the number and total area of the nucleoli were changed in SETD8 knockdown senescent cells.*2
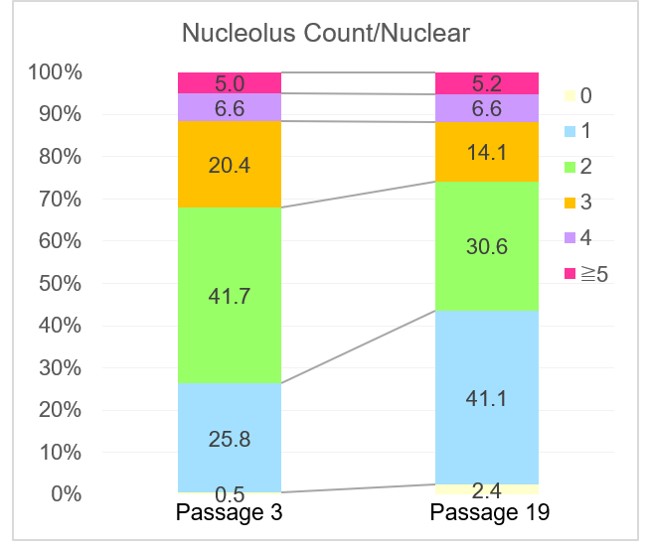
*1 P. M. Bemiller, L. Lee, “Nucleolar changes in senescing WI-38 cells”, Mech. Ageing Dev., 1978, 8, 417.
*2 H. Tanaka, S. Takebayashi, A. Sakamoto, T. Igata, Y. Nakatsu, N. Saitoh, S. Hino, M. Nakao, “The SETD8/PR-Set7 Methyltransferase Functions as a Barrier to Prevent Senescence-Associated Metabolic Remodeling.”, Cell Rep., 2017, 18(9), 2148.
Excitation & Emission
Q & A
-
Q
Can I stain live cells?
-
A
We ask the reagent to be used on the fixed cells. We do not recommend using it on the live cells.
[Co-staining Protocol of HeLa Cells]
1. HeLa cells were seeded on a μ-slide 8 well plate and cultured at 37 ℃ overnight in a 5% CO2 incubator.
2. After the culture medium was removed, 4% PFA/PBS solution or cool methanol was added to each well and the plate was incubated at room temperature.
*Incubation time, 4% PFA: 5 minutes, cool methanol: 1 minute.3. The supernatant was removed and the cells were washed with PBS three times.
4. To permeabilize the nuclear membrane, 1% Triton X-100/PBS solution was added to each wells and incubated at room temperature for 20 minutes.
5. The supernatant was removed and the cells were washed with PBS three times.
6. The mixture of Nucleolus Bright working solution and DAPI solution (200 µl) was added and the cells was incubated at room temperature for 5 minutes.
7. The cells were observed under a fluorescence microscope.
Handling and storage condition
| Appearance: | Reddish orange to red solid |
|---|---|
| Purity (HPLC): | ≧ 90.0 % |
| Protect from light |
Related products
The following related products are also used in research related to this product.


